'Normal' vs 'Optimal' Lab Values: Why Your Doctor and Biohackers Don't Speak the Same Language

Your doctor says your labs are normal. Biohackers say you can do better. Who's right? Decoding laboratory reference ranges.

"Your results are normal." You've probably heard this phrase. But what does "normal" really mean? And why do some health enthusiasts aim for very different values?
The Fundamental Misunderstanding
"Normal" doesn't mean "optimal." Laboratory reference values are based on population statistics — not on what's best for your long-term health.
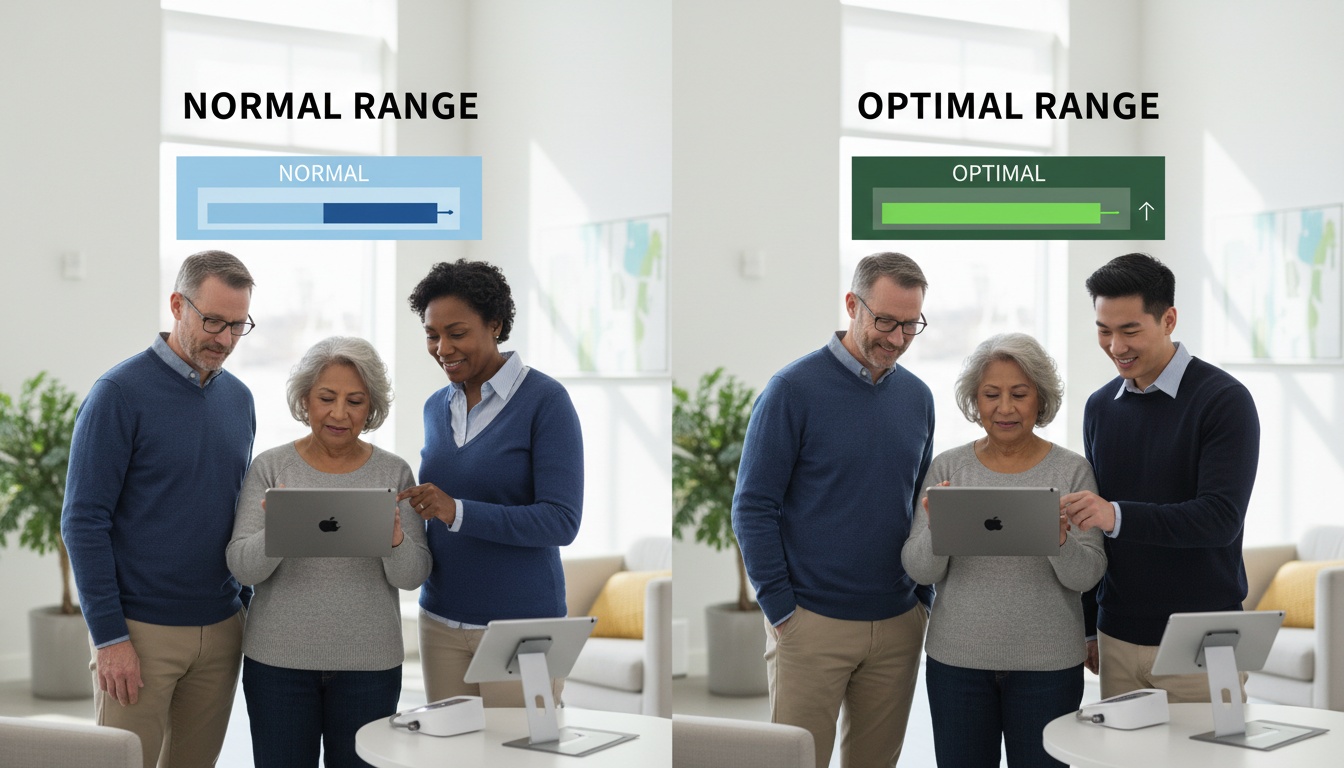
How Are "Normal" Values Defined?
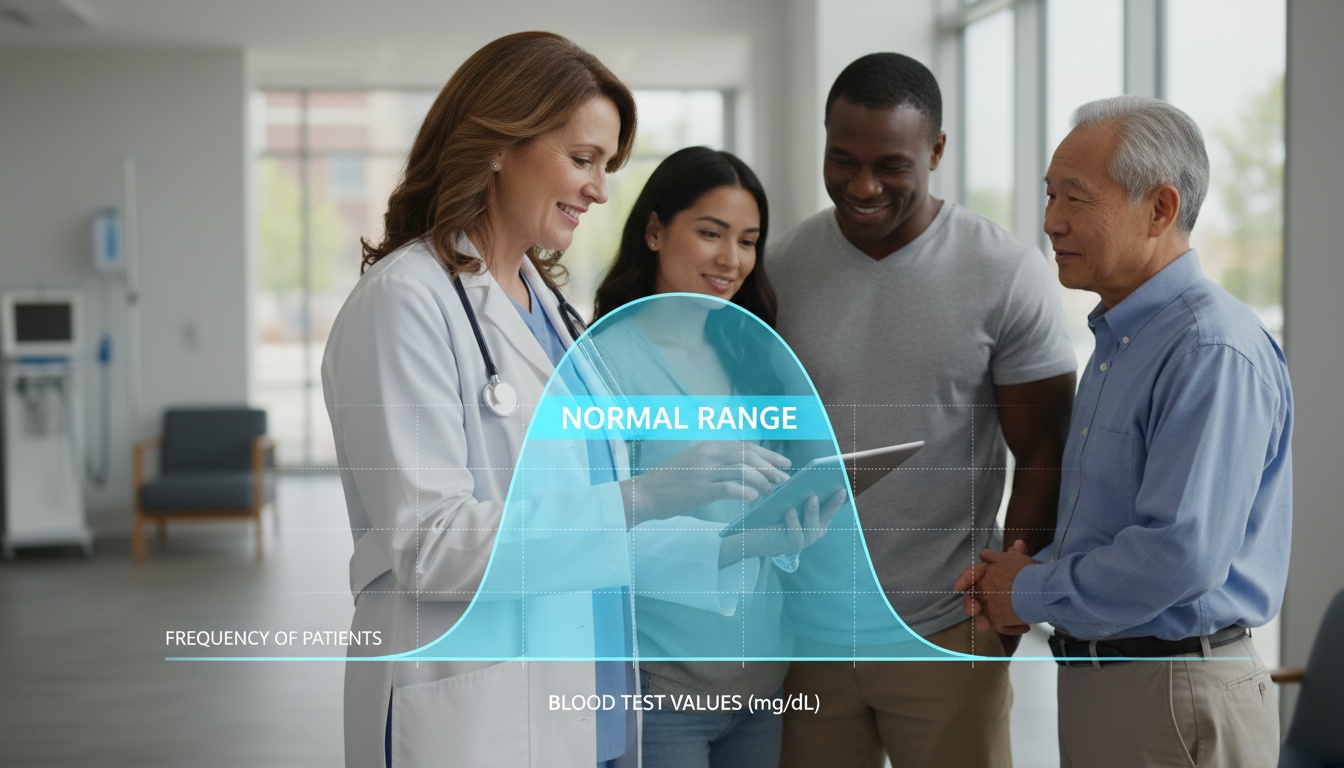
The Statistical Method
Population Sampling
The lab measures a parameter across a large sample of "apparently healthy" people.
Distribution Calculation
This produces a bell curve (normal distribution).
Defining the 'Norm'
The middle 95% are considered "normal" — the 2.5% at each extreme are "abnormal."
The Problem With This Approach
Biases in Reference Values
- Non-optimal population: Samples include overweight, sedentary, stressed people
- Geographic variation: Norms change by country and lab
- No fine-tuning: Even same sex/age, individual needs vary
- Disease threshold ≠ optimization threshold: "Not sick" doesn't equal "thriving"
If the reference population is unhealthy, being "in range" just means you're as bad off as they are.
The Biohacker "Optimal" Approach
Longevity enthusiasts don't just aim to avoid disease. They target values associated with:
- Maximum longevity
- Optimal cognitive performance
- Sustained energy
- Minimal cardiovascular risk
Concrete Examples: Normal vs Optimal
| Marker | Lab Normal | Biohacker Optimal | Why |
|---|---|---|---|
| HbA1c | < 5.7% | < 5.0% | Minimize protein glycation |
| Vitamin D | 30-100 ng/mL | 60-80 ng/mL | Immunity, muscles, mood |
| Ferritin (M) | 30-400 ng/mL | 50-150 ng/mL | Avoid excess (pro-oxidant) |
| TSH | 0.4-4.0 mIU/L | 1.0-2.0 mIU/L | Optimal metabolism |
| hsCRP | < 3.0 mg/L | < 0.5 mg/L | Minimal inflammation |
| Homocysteine | < 15 µmol/L | < 7 µmol/L | Cardio + cognitive health |
Case by Case: Decoded
Vitamin D: The Most Glaring Gap
Why the Gap?
The 30 ng/mL threshold was set to prevent bone diseases (rickets, osteoporosis). But benefits for immunity, mood, and muscles require higher levels.
A level of 35 ng/mL is "normal" but may be insufficient for optimal immune function.
TSH: When "High Normal" = Suboptimal
The Thyroid Case
Typical scenario:
- TSH at 3.5 mIU/L → "Normal" for the lab
- But: fatigue, weight gain, feeling cold
- Functional medicine: Optimal TSH between 1.0-2.0
Why? A high-normal TSH means the pituitary is "pushing" the thyroid — possible early dysfunction.
Ferritin: The Extremes Trap
| Situation | Level | Problem |
|---|---|---|
| Too low | < 30 ng/mL | Anemia, fatigue, hair loss |
| "High normal" (men) | 300-400 ng/mL | Oxidative stress, inflammation |
| Optimal | 50-150 ng/mL | Iron/antioxidant balance |
A man with ferritin at 350 ng/mL is "in range" but potentially in iron excess, a factor in accelerated aging.
The Conventional Medicine Position
Why Your Doctor Uses Standard Norms
The Medical Logic
- System efficiency: Impossible to optimize every patient individually
- Clinical evidence: Randomized trials use disease thresholds
- Reimbursement: Treatments are validated for defined pathologies
- Primum non nocere: Avoid over-treating or creating anxiety
Legitimate Criticisms of the Biohacker Approach
Risks of Optimization
- Over-supplementation: Vitamin D at 100+ ng/mL can be toxic
- Number fixation: Counterproductive stress and anxiety
- Cost: Frequent tests not covered by insurance
- Lack of evidence: Few studies on "optimal" ranges long-term
A Balanced Approach
When to Aim for Optimal
When Standard Norms Are Enough
How to Use This Information
Know Your Values
Keep a history of your labs. Trends matter more than a snapshot.
Understand Context
"Normal" means "not sick according to this parameter." Valuable but limited.
Discuss with Your Doctor
Share your goals. A good doctor will explain why they agree or disagree.
Avoid Extremes
Neither optimization paranoia nor blind ignorance of trends.
With Genki
Visualize Your Data
Genki lets you:
- Import your labs from any laboratory
- Compare your values to norms AND optimal ranges
- Track trends over multiple years
- Understand what each marker means for YOU
Final Thoughts
"Your doctor isn't wrong to say "normal." Biohackers aren't wrong to aim for "optimal."
These are two different questions:
- "Am I sick?" → Lab norms
- "Can I do better?" → Optimal ranges
Both have their place.
"
The goal isn't to become obsessed with numbers. It's to understand what they really mean — and have an informed conversation with your doctor.
Prêt à organiser vos données médicales ?
Genki vous aide à centraliser et comprendre tous vos documents de santé, sans cloud, directement sur votre appareil.
Essayer Genki gratuitement